July 11, 2019 - In the past year, one might have noticed a certain alarmist tone in the press’s coverage of leveraged lending. Commentators have pointed to potential overheating, overleveraging (or, at least, overgrowth) of the loan market. We’ll acknowledge that leverage is higher and documents are looser. But we’d also gently recommend that commentators consider i) a data-based analysis of 2019 versus 2018 and ii) an apples-to-apples comparison to bonds. The real story is – as it often is – a bit more nuanced.
To facilitate this analysis, quantitative shops LPC, S&P/LCD and LevFinInsights (LFI) all published their first half reviews last week. Today, we abstract their numbers and conclusions and, of course, responsibly link to the original sources.
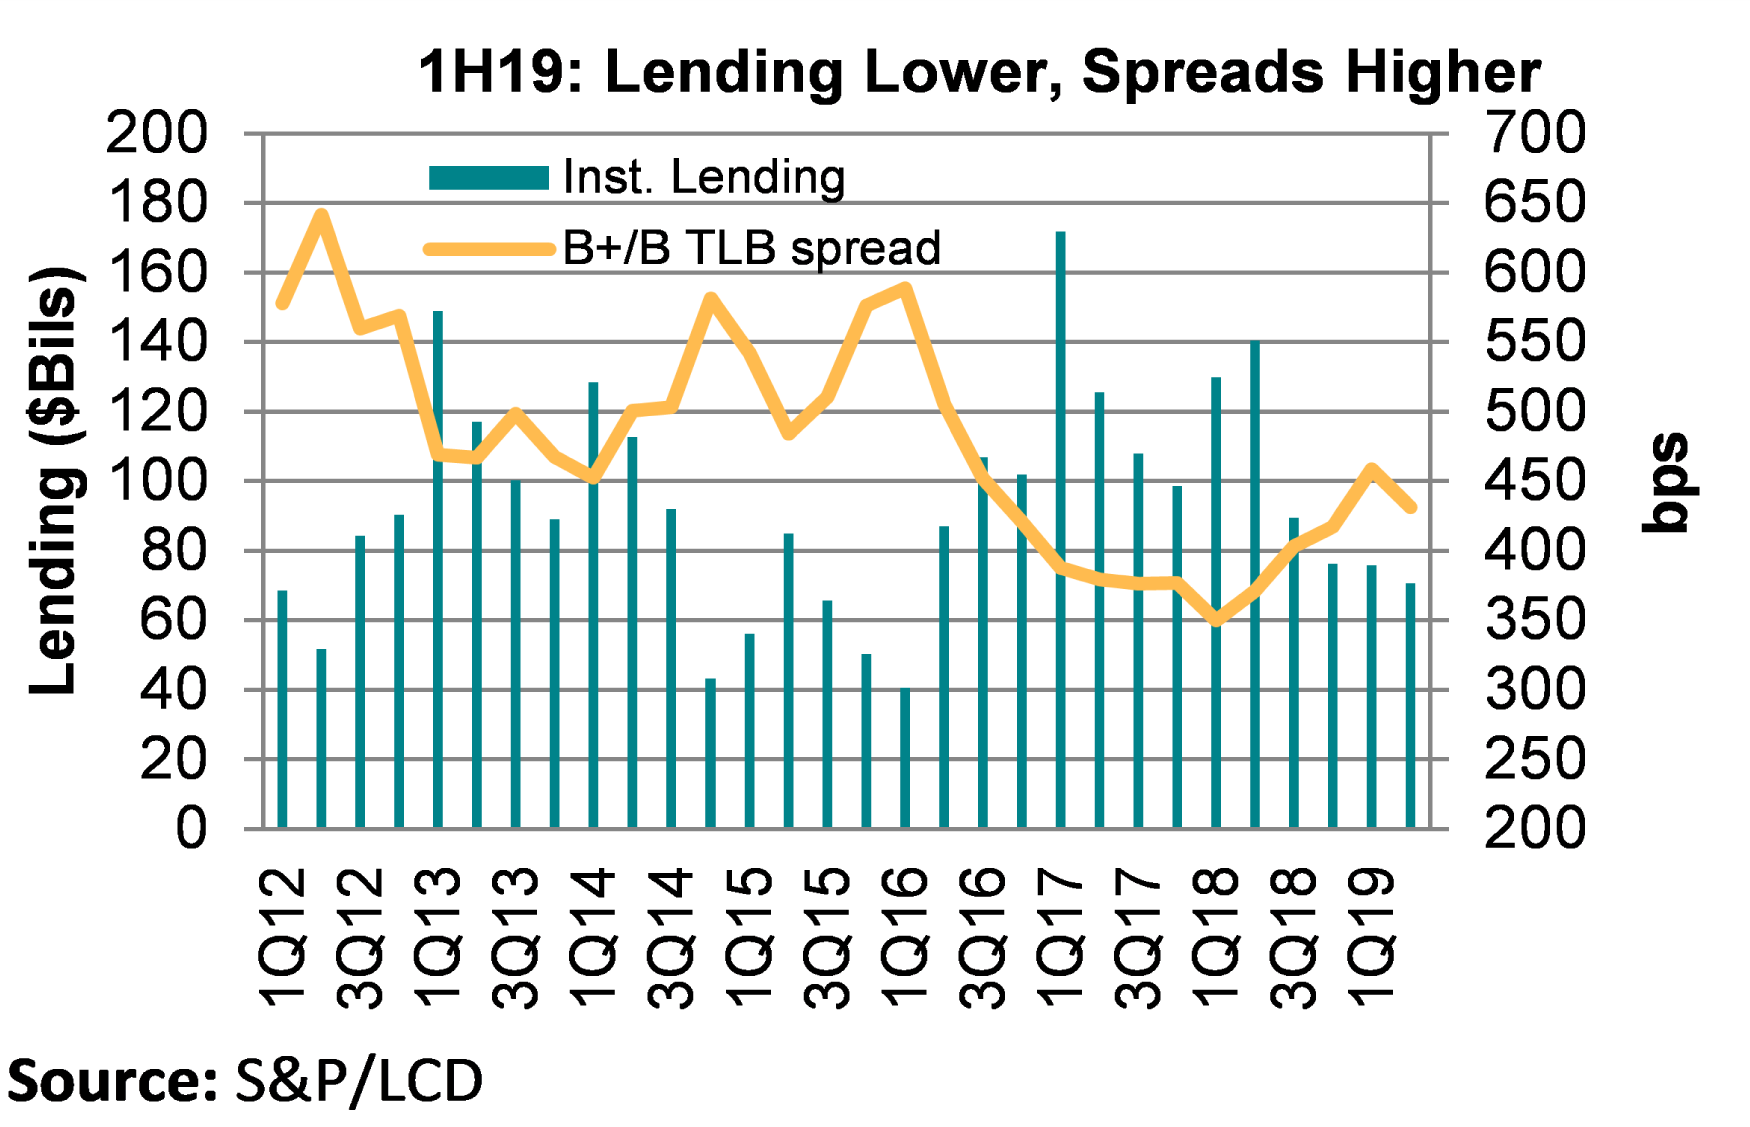
First, regarding that overgrowth theory. As the LSTA COW demonstrates, relative to the same time last year, leveraged lending has declined and spreads have risen significantly according to every analytical shop. (Caveat: Each firm uses a different data collection and calculation methodologies and thus their numbers don’t align perfectly … but their trends do.) According to LPC, relative to first half 2018, 1H19 leveraged lending dropped 53% to $354 billion, while institutional lending was off 69% to $151 billion. LFI sees “gross” lending down 69% to $158 billion, and “net” lending is off $42% to $93 billion. Meanwhile, LCD’s leveraged volumes fell 37% to $239 billion, while institutional lending declined 46% to $147 billion. S&P/LSTA Leveraged Loan Index outstandings, meanwhile, increased just 4% in the first half of 2019.
The reality is that lending in every segment eased relative to the first half of 2018. With higher spreads (see COW), purely opportunistic refinancings became uneconomic. And with trade wars and some growth concerns, M&A activity – sponsored and corporate – also declined. The only category that increased, according to LCD, was “other”.
But while the loan market was quieter, the high yield bond market was accelerating. Both LPC and LCD tabulate HY bond issuance north of $130 billion, an increase of 16-20% relative to first half 2018. And LFI observes very interesting HY bond pricing trends. A number of borrowers issued both secured bonds and loans in the first half of 2019 – and many of the bonds priced with lower yields than the loans. Admittedly, the bonds are senior and secured and pari passu with the loans. However, upon further inquiry with our friends at LFI and Covenant Review, it became clear that even though most of the pari loans were covenant lite (e.g., didn’t have maintenance covenants), “the structures of a high yield secured bond are typically more permissive than that of a secured loan.” So, to be clear, the bonds had i) thinner pricing and ii) more permissive structures than their pari passu loan. Why might this be? One reason might be a high value placed on bonds’ non-call option. Alternatively, it may have more to do with money running toward bonds. Year-to-date, HY bond mutual funds have seen nearly $13 billion of inflows, while loan mutual funds have seen redemptions on the order of $18 billion, according to LPC’s Leveraged Loan Monthly. We believe this divergence has two main drivers: First, with a shift from rate hikes to rate cuts, fixed rate assets may reasonably become more attractive than floating rate ones. Second, perhaps less reasonably, loans have been pilloried in the press, while high yield bonds mostly have gotten a pass – even when their terms are weaker.