
April 4, 2019 - April 4, 2019 – On the good news front, first quarter in the loan market was so much better than it could have been. The secondary market rebounded off multi-year lows, quality loans cleared easily and default rates fell to seven year lows. On the other hand, it was an anemic quarter by almost every measurement. With a drumbeat of negative press, declining interest rate expectations and challenging CLO arbitrage, investor demand slackened. But as feeble as demand was, supply was more anemic, setting up conditions for a modest market recovery. We recap these trends below.
From a statistics perspective, first quarter 2019 was a sea of red. As the nearby volume table demonstrates, new lending dropped in every category from the year-earlier figures. 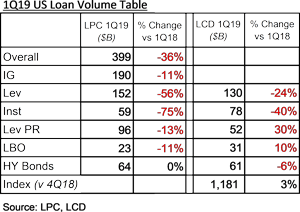 There was limited M&A activity, though the LBO segment held up relatively well by declining only 10%. With loan spreads higher than in the first nine months of 2018, opportunistic activity was rare and repricing activity was absent. As a result, LPC’s leveraged lending stats fell to a three-year low. On the institutional side, LCD saw lending at $78 billion and LPC tracked it at $59 billion, off 40% and 75%, respectively, from 1Q18 levels. Meanwhile LevFinInsights reported net priced institutional volume at $44.7 billion, the lowest level since they started tracking it in 2016.
The loan market’s loss was the high yield bond market’s gain. Depending on the provider, HY bond volume was either flat (LPC) or down marginally (LCD). With interest hike expectations ebbing and financial press apparently yellowing, investors shifted their allegiance from loans ($10 billion in mutual fund outflows) to HY bonds ($11 billion in inflows). Issuers, no fools, quickly followed. As the COW demonstrates, while institutional lending is well down from 2018 ranges and flat on 4Q18, HY bond issuance jumped significantly from late 2018. At more than $60 billion, first quarter bond issuance is up 300% from fourth quarter 2018. More impressively, secured bond issuance is up seven-fold from last quarter. This generally came at the expense of loans. LCD tracked $15 billion of bond-for-loan takeouts. LevFinInsights highlighted the fact that Commscope, D&B and Power Solutions all carved out first-lien bonds from M&A transactions, while TransDigm skipped the loan market entirely in its acquisition financing. These four transactions alone sucked $8 billion of supply from the loan market. Bottom line on the supply side? Outstandings in the S&P/LSTA Leveraged Loan Index increased by $34 billion (or a modest 3%) during the first quarter.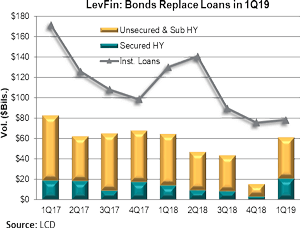
While loan supply was anemic, so was investor demand. Loan mutual funds suffered another $10 billion in outflows in first quarter and some $24 billion of outflows in the past 19 weeks, according to LPC. CLO issuance appears solid at $29 billion, but this belies the fact that many first quarter deals were filled with loans sourced in 2018. Meanwhile, LevFinInsights reports that SMA demand is tepid as well.
So what happened to loan terms when anemic supply met tepid demand? Terms loosened from the December market bloodbath, but remain tighter than those seen through much of 2018. First, the average bid in the S&P/LSTA Index climbed to a solid-but-not-spectacular 96.41 at the end of March, up 250 bps from its year-end lows, but well below the mid-98s seen during much of 2018. Likewise, the share of loans priced above 100 recovered from 0% in January to 3% in March, but remain a far cry from their 68% share in third quarter 2018. (More coverage on secondary trends is coming next week.)
While the secondary market remains well below its 2018 highs, January’s snapback was enough to shift the trend in the primary market. Having suffered a rout in December that drove new issue B+/B all-in spreads to the LIB+580 context, loans that entered the market in January were (relatively) conservatively structured and priced. Meeting milder market conditions, a number of these loans were able to adjust marginally in borrowers’ favor. The evidence? After 60 upward flexes and 41 reverse price flexes in fourth quarter 2018, the trend reversed, with 45 deals reverse flexing and 14 flexing higher in first quarter, LevFinInsights reported. As a result, spreads on B+/B rated loans tightened to LIB+438 by March, LPC added.
So, where do we go from here? LevFinInsights notes that today’s fragile equilibrium may stick for a while. Investor demand is modest; meanwhile the M&A pipeline is not terribly strong and the loan market may remain too weak for meaningful opportunistic activity. Moreover, with continued inflows, high yield may continue to be the preferred medium for issuers and investors. All this suggests that loan activity may remain muted for the next few months.


