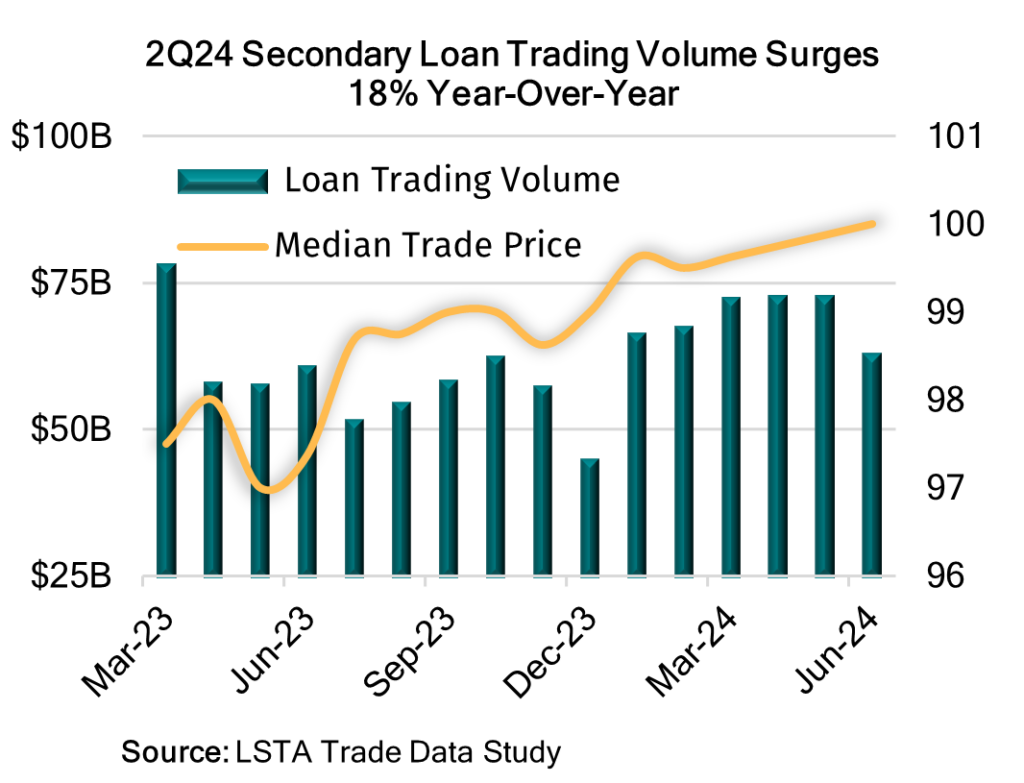
July 23, 2024 - 2Q24 secondary loan trading volume increased quarter-over-quarter by more than 1% to $208 billion, according to the LSTA’s Trade Data Study. But most impressive, 2Q volumes spiked 18% over the same time last year, which drove a 7% year-over-year increase in activity across the first half of 2024. Equally impressive, the number of individual loans trading on a per-month basis increased 5% in 2024, to an average of 1,550 loans.

Even though monthly trading volumes fell 13%, to a seven-month low of $62.7 billion, during a choppy June, second-quarter activity still marked the busiest quarter in over a year. In looking back, May was a hard comp to beat; at a 15-month best $72.5 billion. Furthermore, the month of May marked the third consecutive time where volumes ran north of $72 billion – a feat not seen in more than 2 years. And of course, a key driver here was a flourishing CLO market that printed more than $100 billion of new deals across the first half of 2024, not to mention the additional $73 billion in resets and $39 billion of refinancings, according to Citi Research. Away from CLOs, LSEG Lipper reported YTD inflows of $12 billion into loan mutual funds and ETFs, with $8 billion hitting the market during the second quarter – the strongest three-month stretch since the Fed began raising rates some two years ago. And as visible demand levels were rising, liquidity markers were improving with 52% of 2Q24 trading volume transacting at a “Mark-to-Market” (MTM) bid-ask spread of 50 basis points or less, according to LSTA/Refinitiv MTM bid and ask loan prices. Furthermore, those excess demand dollars met head on with a scarce amount of “net new” lending activity, which created a technical back drop that drove more than 50% of trade activity to a price point of par value or better (up from 1Q24’s 39%). As a result, the median trade price increased to 100 cents on the dollar by the end of June, marking the first time in more than three years that the median level sat at par value. On the year, the median price increased 100 basis points while the average price was higher by 68 basis points, to 97.03. That said, most of those gains occurred during the first quarter as the market traded mostly sideways across the second.
While volumes swelled in the secondary as traders chased scarce new paper, that same excess demand drove opportunistic deal flow in the primary. Borrowers have been the beneficiaries this year with extensive refinancing activity allowing for sizable reductions in interest expense and/or maturity date extensions. According to Pitchbook LCD, this year’s record refinancing activity (which includes extensions and repricings done via amendments) totaled $625 billion, with 57% or $354 billion of the total getting done during the second quarter.
In conclusion, 2Q24 was a statistical success from many vantage points, and the LSTA’s Trade Data Study went on to highlight several of those positive trends. First, MTM median bid-ask spreads on the traded universe of loans hovered around their two-year tights, ending June in a low 50-basis point range. Second, MTM price accuracy (as measured by the absolute differential between trade and MTM prices on trade date), remained strong, with the median differential reported at its three-year low of just 13 basis points. Third, the percentage of par trades settled within T+7 stood strong at a three-year best 33% market share. Even more impressive, the percentage of buyside sales settled within the same seven-day period approached 50% -marking the second-best quarter reported by the LSTA since we began tracking that statistic back in 2016.


