January 9, 2020 - A review of 2019 U.S. syndicated lending data reveals several interrelated macro trends. From the borrower side, there appeared to be less appetite to utilize the syndicated loan market. From an investor perspective, the year was marked by recovery, risk-off and the rebound dynamics. Below, we discuss the dynamics and dig into the data.
First, lending activity. Borrowers simply reduced their utilization of the loan market, nearly across the board. M&A and LBO activity slumped, while higher spreads generally – though not exclusively – reduced the attractiveness of refinancings and repricings. On the volume side, LPC saw leveraged lending drop 35% (to $808 billion) in 2019; S&P/LCD saw a decline of 23% (to $480 billion); Leveraged Finance Insights (LFI) tracked a 45% drop in institutional “priced deals” to $392 billion. Much of this came from a decline in corporate M&A and LBO activity – down 49% and 22%, respectively, according to S&P/LCD – as would-be acquirers faced an unusual combination of high purchase prices, geopolitical uncertainty and economic growth worries. And when merger financing did emerge, it was increasingly skewed toward the high yield bond market. LPC notes that in contrast to a decline in new loan activity, 2019 high yield bond issuance jumped 62% to $267 billion. LFI adds that first lien secured bond issuance jumped from $47 billion in 2018 to $70 billion in 2019, suggesting a pretty clear substitution effect.
But do these volume trends portend the end of the leveraged loan market? Hardly. LPC publishes investment grade lending volumes and noted that the trends were broadly similar. Investment grade M&A shrank 20%, and reported that high-grade borrowers were watching higher prices, lower earnings outlooks and geopolitical risks.
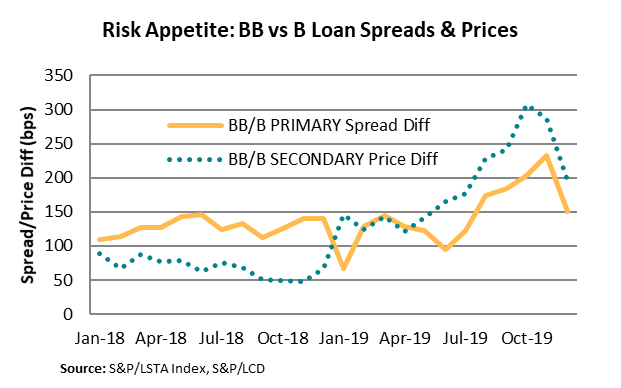
While borrower appetite remained muted much of the year, investor appetite vacillated. Primary and secondary market pricing statistics describe a market defined by recovery (from December 2018’s sell off), a risk-off mentality (starting late summer), and a rebound from oversold conditions (December). These dynamics can easily be seen when comparing BB and B (or, even better, B3) rated loans. This week’s COW compares the difference between BB and B rated loans, looking at both primary market spreads and secondary market prices. As the COW demonstrates, the differential between new issue spreads on BB and B rated loans was well less than 150 bps through summer. Likewise, secondary prices on BB loans sat less than 150 bps above prices on B rated loans. But as a risk-off mentality pervaded the market late in the year, the pricing dynamics between BB and B rated loans shifted. By November, spreads on new BB rated loans were 230 bps inside those of new B rated loans. Meanwhile, prices of BB rated loans sat some 300 bps above B rated loans in the secondary. At this point, commentators were forecasting the end of the leveraged loan market. But the selling was overdone. As investors became more comfortable with the risk environment (aided by relatively slow 4Q19 supply), secondary prices snapped back. The overall market bid jumped 114 bps (to 96.72) in December. The bulk of this jump came from oversold B rated loans, which rallied 142 bps to 97.70; BB rated loans climbed just 51 bps to 99.65. In turn, as the COW demonstrates, the secondary price differential dropped by nearly 100 bps.