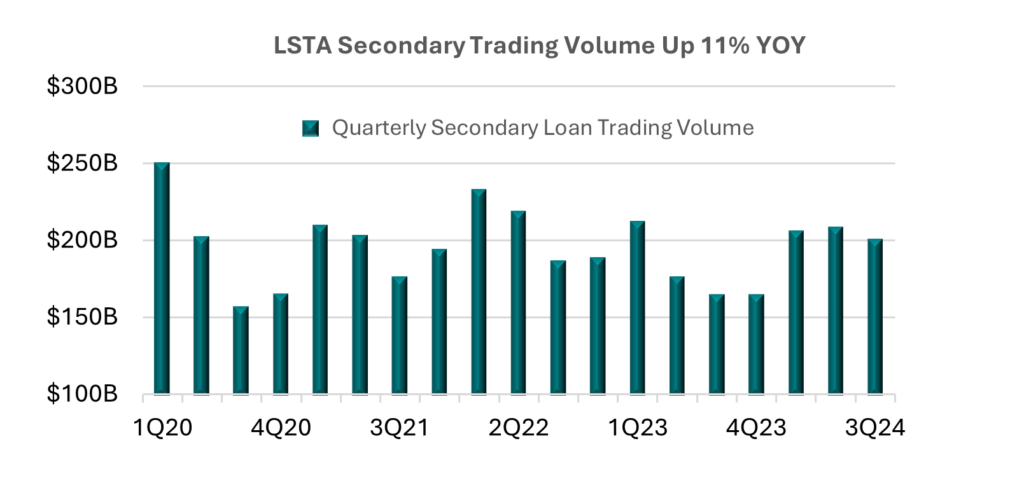
October 21, 2024 - While 3Q24 secondary trading volume declined quarter-over-quarter by 4%, activity increased a noteworthy 22% over the same time last year. Looking even deeper, there were no signs of a seasonal summer slowdown with 3Q24 volume totaling more than $200 billion – a record high for third quarter activity, according to the LSTA’s 3Q Trade Data Study. But most impressively, trading volumes have remained historically steady in 2024, after running north of $200 billion per quarter all year; a first time for the loan market. In turn, YTD volumes have spiked 11% over the first nine months of last year. And at this current run rate, annual volumes are on target to total more than $817 billion, or just 1% behind the all-time high figure establish back in 2022. But the market was clearly different back then. Two years ago, traders were managing a very active net-new-issue market that led to a massive growth cycle in loans outstanding, whereas this year, primary market activity has centered on opportunistic refinancing and repricing activities. In turn, the size of the broadly syndicated loan market has contracted roughly $14 billion this year, according to the Morningstar/LSTA Leveraged Loan Index. But despite that fact, higher trading volumes have been driven by a sizeable increase in market breadth – or the number of individual loan facilities trading. With traders needing to cast a wider net in the secondary this year, the number of distinct loans trading monthly has averaged north of 1,570 loans, or a 6% increase over last year. On average, 625 individual loans changed hands each day this year, totaling more than $3.3 billion in daily trading activity.

In looking back across the first nine months of 2024, volatility levels remained mostly muted in the secondary, that is with the exception to August, where intra-month volatility spiked to the highest level since the Fed began raising rates in early 2022. But the early August sell-off lasted only momentarily as prices rebounded quickly and continued to churn higher through September while bid-ask spreads hovered in a mid-50 basis point range. As of the quarter’s end, the average trade price hit a 2024 high of 97.33, up roughly one point from the intra-year low established back in January. On the other hand, the median trade price ended in September at 99.75, after hitting a two-year high of 100 during June and July. This 25-basis-point decline in the median trade price was mainly a product of the re-financing wave, which went on to take out a portion of loans that were trading in a par-plus context. After peaking at more than a 50% market share of trading activity during the three-month period ending July, par-plus trading volume fell to a 41% share during September, still a rather frothy level from a historical perspective.


