
July 5, 2018 - Between tariff tiffs, G7 tensions, a volatile equity market and a slumping high-yield bond space, second quarter was pretty rocky in some quarters, Thomson Reuters LPC observed. The loan market, in contrast, was simply rocketing.
Overall U.S. syndicated corporate lending – including investment grade – hit $821 billion in second quarter, up 16% from the 2Q17’s erstwhile record, according to TR-LPC. Indeed, as the nearby 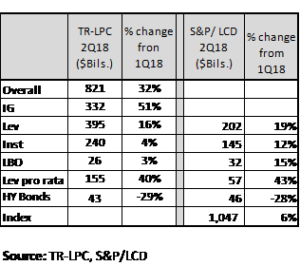 volume chart indicates, lending was up in all segments of the loan market: Investment grade lending hit a record $332 billion, up 51% from first quarter and 25% year-over-year. While not all segments set records – in part because refinancing activity eased – nearly all were strong. TR-LPC and S&P/LCD saw leveraged lending climb 16% (to $395 billion) and 19% (to $202 billion), respectively. TR-LPC saw institutional lending at $240 billion (up 4% from 1Q18) and LCD tallied it at $145 billion (up 12%).
What drove these volumes? Mostly M&A activity. In the investment grade space, TR-LPC tracked a record $95 billion of merger-related lending. In leveraged land, LCD counted $110 billion of M&A loans, edging past 2Q07’s record $105 billion. Much of the leveraged M&A still came from corporate lending; LBO lending was one of the categories that did not set a record last quarter. That said, LBO lending accelerated during the quarter, as DebtWire charted. According to their numbers, at $15 billion, June LBO lending surpassed April and May combined. What didn’t benefit from the M&A trend? The high yield bond market. With the merger surge mostly skipping bonds, HY issuance was down quarter-over-quarter (-28%) and year-over-year (-32%).
On the back of much more “real” lending – as opposed to refinancings and repricings – loan outstandings climbed. The S&P/LSTA Leveraged Loan Index ended second quarter at $1.047 trillion, up $54 billion in second quarter and $89 billion for the year. This strong supply handily outpaced demand for the first time since 2016’s energy slump. U.S. visible institutional demand has totaled “only” $76 billion in 2018, comprising $65 billion of CLO issuance and $11 billion of loan mutual fund inflows, according to TR-LPC. (In contrast HY bond funds suffered $23 billion of outflows in the first half of 2018.)
As supply surpassed demand, pricing trends turned in favor of investors, LevFinInsights wrote. To be fair, in both April and May, reverse flex outpaced upward flex by nearly 2:1. But June saw just 18 reverse flexes and 42 upward ones – and 18 of those came in the final week of the month.
And then there was repricing, or the decline thereof. True, there was $45 billion of repricing in April and $59 billion in May, but as technicals shifted, repricing activity plummeted to $19 billion in June, LFI notes.  A big driver of this drop was a retreat from LIB+175 loans. There was $23 billion of LIB+175 volume in May – and just $400 million in June. LFI explains why: First, a number of the LIB+175ers traded through their OIDs in the secondary market. Second, as CLO liability spreads widened, the economics of LIB+175 loans became more challenging. But a repricing backlash may encompass more than LIB+175 aspirants. LFI points out that the repricing trend might be somewhat played out (at least for now). The size of spread reductions has been declining; by 2Q18, 90% of repricers were slicing 50 bps or less from their loan spreads.
And, of course, widening loan spreads also could dampen the repricing fire. Admittedly, BB/BB- TLB spreads hit post-crisis low of LIB+219 in 2Q18. But this statistic hides the fact that BB/BB- spreads bottomed out at LIB+203 in May and then rebounded to LIB+232 in June. Spreads on B+/B rated TLBs were more straightforward: They climbed 20 bps to average LIB+360 in second quarter – and ended June at LIB+379.
More volume, wider spreads and fewer repricings are all good news for lenders. And there’s one last happy note: Three-month LIBOR has been sitting in the 2.3% context and one-month LIBOR climbed 20 bps to the 2.09% context in the past three months. As a result, investors buying new B+/B loans have been enjoying yields in the 6% range.


