

July 13, 2023 - While the opening days of the third quarter have been positive – secondary prices have strengthened, CLO formation has rebounded somewhat and several deals are sailing through primary – the second quarter was uninspiring in the US leveraged loan market. Both loan supply and loan demand remained muted, yields remained high and defaults climbed sharply (albeit off very low levels).
On the supply side, Pitchbook LCD (“LCD”) noted that at $103 billion year-to-date, institutional lending is at the lowest level since 2010. Moreover, the large majority of that was refinancing. M&A (and other activity) was nearly MIA, with a year-to-date tally of $36 billion the lowest seen since the GFC in 2009. While new issue loans were slow to come online, HY was recovering from 2022’s epic lows – issuance to date topped $90 billion, up 26% year-over-year – according to Refinitiv’s Leveraged Loan Monthly. And borrowers put at least $14 billion of this to work refinancing loans, LevFin Insights (LFI) added. While HY was eating away from BSL share from one side, private credit continued to encroach from the other, albeit at a somewhat slower rate than in the first quarter. LCD tracked 38 LBOs financed by Private Credit in second quarter, as compared to seven done in the BSL market. In light of this, it may not be surprising that outstandings in the Pitchbook LSTA Leveraged Loan Index ended the second quarter at $1.394 trillion, down $22 and $42 billion from 2023 and 2022 highs, respectively.
But insipid supply was more (less?) than matched by anemic demand. Open-end loan funds continued to see material, though slower, outflows, keeping their market share below 10%. CLOs – which hold more than 70% of outstanding loans according to Refinitiv – also face their challenges. Most immediately, CLO formation has fallen off materially this year. LCD noted that after just $55 billion of CLO issuance in first half, a number of analytical shops were cutting their full-year forecasts. But the other challenge is that CLOs are rapidly exiting their reinvestment periods. Barclays reported that 24% of outstanding CLOs are out of their reinvestment period (RP), and this could climb to 40% by year-end. As more CLOs exit their RP and become increasingly constrained from participating in new loans or extensions, investor demand for loans may continue to decline. But two positive codas: At the very end of June and beginning of July, BSL CLO issuance (and resets!) seemed to be making a comeback. And while BSL CLOs may be shrinking, middle market/private credit CLO issuance has increased substantially, topping $11 billion, and nearly matching their full-year 2022 stats.
After a few bipolar months, the secondary market shifted to an upswing in the late second (and early third) quarter. Secondary prices bottomed repeatedly between 92.5 and 93 in early January, late March, and early June and peaked around 94.7 in mid-February. However, at 94.8 earlier this week, secondary bids hit their highs of the year (see Secondary Trading Monthly for details).
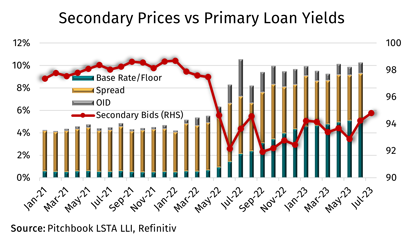
While secondary prices (recently) have been rising, it hasn’t been much comfort to borrowers in the primary. Though institutional loan spreads have come down in the past year, this has been more than counterbalanced by SOFR climbing from less than 1% in May 2022 to more than 5% now. According to Refinitiv (and the COW), new institutional loan yields are sitting in (or above) the 10% context – and often above HY bonds. LFI looked at the 17 first-lien bonds and term loans that priced concurrently in 1H23 and saw that the bonds cleared an average of 192 bps inside the pari passu term loan. Another reason, perhaps, that HY is eating into leveraged loans’ market share.
Unsurprisingly, higher loan yields are beginning to pressure companies. Bixby Research, via LFI, noted that of their companies with positive EBIT, 87% had interest expense that totaled 30% or more of EBIT and 75% had interest expense over 50% of EBITDA. Thanks to the 2017 Tax Cuts and Jobs Act, this has tax implications as well as financial stress implications.
But about that financial stress…default rates are climbing sharply, albeit from very depressed levels. According to LCD, the trailing 12-month (TTM) default rate by volume (which excludes distressed exchanges) in the Pitchbook/LSTA Leveraged Loan Index hit 1.71% in June, up from 0.28% a year earlier. Add in distressed exchanges, and things look worse. According to KBRA DLD, 30% of the syndicated loan default rate came from distressed exchanges since 2019, driving their syndicated loan default rate to 2.4% year to date. In fact, KBRA DLD could see the syndicated loan default rate at 4.5% by volume by year-end, above the 3.25% forecast for HY.
What other fun is on tap for us in the coming months? LFI lays out some themes they are watching as we move into the back half of the year: i) More bonds to repay loans; ii) Limited M&A activity; iii) Continued refinancings of loans with near-term maturities; iv) Flight to quality; and v) Consequentially, the Kirschner Case, which will determine whether loans are securities and subject to the securities laws.


