
February 22, 2018 - Aside from a short bout of volatility in early February, when the average S&P/LSTA Index price shed 25 bps, the market started 2018 the way it left off 2017: Aggressively.
On the documentation side, Xtract highlighted several areas in January loans: foreign guarantors (under the new tax code), MFN language, EBITDA adjustments, ECF sweeps, contribution debt, asset sales sweeps, cash out provisions and pro rata sharing changes. But Xtract also flagged a sliver of good news: One deal included a prohibition against transferring IP out of the domestic group under the asset sale covenant. (Think J. Crew backlash.)
In a similar vein, Covenant Review noted that leverage levels on early 2018 M&A loans have rebounded from a modest fourth quarter 2017 dip. First lien leverage climbed from roughly 4x to 4.39x, while total leverage popped from roughly 5x to 5.75x. Because EBITDA adjustments also increased, unadjusted leverage climbed further, hitting 5.55x first lien and 7.45x total in early 2018. There were two reasons for the climb: First, after a dip in fourth quarter, LBO market share has rebounded so far in 2018. Second, early-2018 LBOs are more leveraged than 4Q17 ones.
So, how high is leverage relative to 2007 peaks? Covenant Review analysis of the 12 largest LBOs in 2017 and 2007 suggest that leverage still is generally below the prior peak. Using their data, we built the LSTA Chart of the Week. 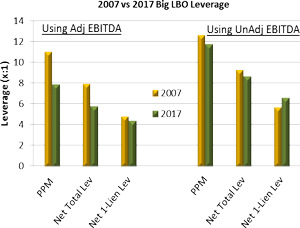 As the COW demonstrates, using adjusted EBITDA figures (on the left), purchase price multiples, net total leverage and net first lien leverage appear significantly higher in 2007 jumbo LBOs. However, EBITDA adjustments are larger today, so looking at PPMs and net leverage levels on an unadjusted basis (on the right) yields a somewhat different result. All metrics are much higher, but the gap between 2007 and 2017 statistics is much narrower. And, importantly, today’s LBOs rely more on senior debt than those in 2007. As a result, the net first lien leverage on an unadjusted basis is higher today than in 2007.
Of course, there are other differences as well. Size, for one. The average purchase price of a jumbo 2007 LBO was $13.2 billion, as compared to $3.775 billion in 2017. This may be relevant when it comes to magnitude of defaults. In this week’s U.S. Leveraged Loan Default Insight report, Fitch charted the source of defaults from 2014 through 2018. Default volume is heavily concentrated by sector – and often by name. Big 2007 vintage LBOs, such as Energy Future Holdings, have brought large volumes of defaults. Likewise, a jumbo 2008 deal – iHeartCommunications – is expected to bring more than $6 billion of defaults in the near future. So, as we’ve always suspected, size matters.


