
May 3, 2018 - The loan market has enjoyed a long period of below-trend default rates. But at some point, the cycle will turn and defaults will return. The question, then, is how will today’s loan vintage perform? Below, we discuss new recovery analysis on covenant lite loans, default stats today (and tomorrow), as well as loan document quality trends thus far in 2018.
Covenant lite loans – those without maintenance covenants on the institutional term loans – have existed for more than a decade, but there has been limited analysis on their recovery given default (“RGD”). While the data is still limited, S&P recently published a direct comparison of the RGD of post-crisis covenant-lite and covenant-heavy defaulters. S&P’s dataset, which is limited simply because there haven’t been many defaults to observe, includes 17 covenant lite loans and 11 covenant heavy ones. Using that dataset, the average RGD of the covenant heavy loans was 82.2% (around the historical average), while the RGD of cov-lite loans was 71.6%. S&P does note that the small sample can be skewed by outliers, like two covenant heavy loans (Colt Defense and Aspect Software) that had RGDs around par. But how does covenant lite-ness affect recovery rating methodology? S&P posits that when a covenant heavy loan trips a covenant, the lenders will raise the loan’s margin in the process of waiving the covenant violation. This higher interest cost ultimately may force a company to default somewhat earlier and at a higher profitability than it would if it didn’t have a covenant breach. With more value preserved, lenders see a higher recovery on their loans.
An initial takeaway? With more than 70% of recent institutional loans being covenant lite, RGD might decline. But, that said, recovery given default is relevant only if there is a default. So where are default rates today – and potentially tomorrow? Still pretty low. Fitch reported that April’s TTM institutional loan default rate was 2.6%, down from 2.7% in March. The lone defaulter was retailer Nine West. Indeed, retail dominates much of the default forecast: 40% of retailers are priced below 90 (vs 7% of the overall loan market), 20% are bid at 80 or below (vs. 2% of the overall market) and 26% of Fitch’s Concerns Watchlist is comprised of retail names. Ultimately, Fitch has a default rate forecast of 10% for retail this year, well above their 2.5% forecast for the overall market.
Of course, default rates are driven by failures of the prior generation of deals. So what does today’s generation look like? There is some good news and some bad news.
Xtract offered up an analysis of first quarter 2018 deals, dividing their cohort into 49 large corporate sponsored deals, 22 middle market sponsored deals and 28 non-sponsored deals. On the good news front, financial covenant incidence might be marginally better. Large sponsored institutional loans continue to be almost universally covenant lite, with cov-lite share climbing from 88% in 4Q17 to 92% in 1Q18. But middle market sponsored deals saw cov-lite share ease from 83% to 82%. In the corporate space, cov-lite incidence was lower (and dropping): it fell to 68% in 1Q18, down from 75% in 4Q17.
On the bad news front, EBITDA addbacks continue to become more liberal. Large sponsored deals, middle market sponsored deals and non-sponsored deals all saw the percentage of agreements with uncapped EBITDA addbacks for cost savings and synergies grow (to 69%, 59% and 36%, respectively).
And on the “we need this stat (stat!)” front, Xtract began to track the number of loans that have “black holes” – i.e., language permitting unlimited investments in unrestricted subsidiaries combined with a “trap door” (a provision permitting investments by non-guarantor restricted subsidiaries with proceeds of investments made in them). This combination allows value to leak on an unlimited basis to unrestricted subsidiaries. So, the stats? In 1Q18, 5% of large sponsored deals and 3% of middle market sponsored deals had these “black holes”. No corporate deals included them.
While first quarter covenant trends were not necessarily heart-warming, they reversed slightly in April as investors began to push back, Covenant Review wrote. Consider these comparisons: During syndication, free-and –clear dollar tranches were reduced on 3% of deals in January and February; in March and April, this jumped to 19%. Grower components were decreased or dropped on 4% of deals in January and February; they were reduced on 17% of loans in March and April.
So are we seeing a sea change? Perhaps not permanently – and definitely not universally. 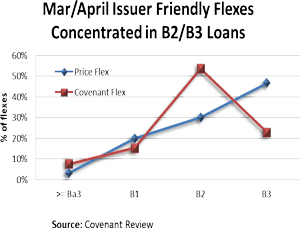 Net supply has been strong, with the S&P/LSTA Leveraged Loan Index growing by $50 billion to $1.005 trillion thus far this year. In turn, lenders recently have had a bit of leverage to push back on deals that are too aggressive. Where have they focused their limited firepower? On lower rated credits. As the nearby chart demonstrates, investor friendly flex activity was concentrated in the B2 and B3 categories.


