May 14, 2019 - Historical Background: Observers have queried whether syndicated loans, which often take longer than three days to settle, belong in open end mutual funds that permit daily redemptions by investors. The concern, which was the subject of debate in 2016 when the SEC issued its open end fund liquidity risk management rule[1] (“the Rule”), is that loan funds may not be able to meet redemptions due to settlement delays. Ultimately, the Rule created a category of assets – “Less Liquid Assets” – that could be sold relatively quickly but took longer than three days to settle. Syndicated loans typically fall into this category and, thus, are permissible assets for open end mutual funds. Still, questions continued about whether loans were sufficiently liquid for an open end structure. December 2018 allowed us to test that question.
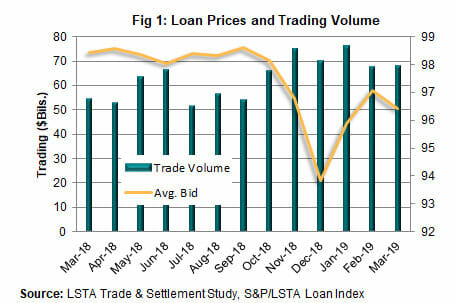
December 2018 Market: As Fig. 1 demonstrates, loans – like all risk asset classes – suffered a period of significant volatility and declining prices in fourth quarter 2018. All told, the average price of institutional term loans dropped from 98.6 at the end of September to 93.8 at the end of December. At the same time, loan mutual funds experienced redemptions totaling $20 billion during fourth quarter and $15 billion in December alone. This created a “natural experiment” that allowed the LSTA to analyze the performance of loans and loan mutual funds in a period of significant stress.
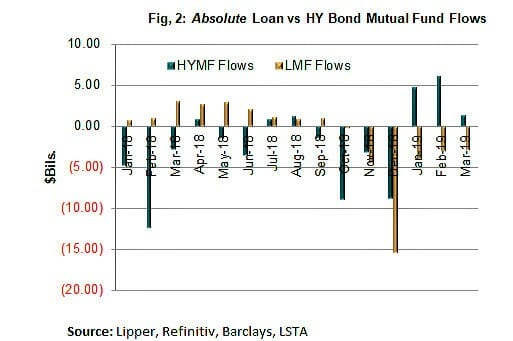
Trading Liquidity in the Loan vs. HY Bond Market: At the same time that loan prices dropped five points, loan trading activity increased from $54 billion in September 2018 to $70 billion December (Fig.1). Many of our members noted that loans actually remained more liquid than high yield bonds in December. The LSTA tested this thesis, particularly in the context of open end mutual funds. In Fig. 2, we compare the absolute level of flows (e.g., inflows or redemptions) in loan and high yield bond mutual funds. High yield bond funds experienced more consistent outflows across the year, which is unsurprising considering that we were in a rising rate environment for much of the year and then faced a risk-off mentality in the fourth quarter. In contrast, loan mutual funds enjoyed moderate inflows most of the year. However, the combination of negative loan headlines, market-wide risk aversion and a shift in interest rate views created sudden and sharp redemptions in loan mutual funds. In December alone, there were $15 billion in redemptions, far above the absolute outflows in the high yield bond market. However, it’s important to remember that high yield bond mutual funds are larger than loan mutual funds.
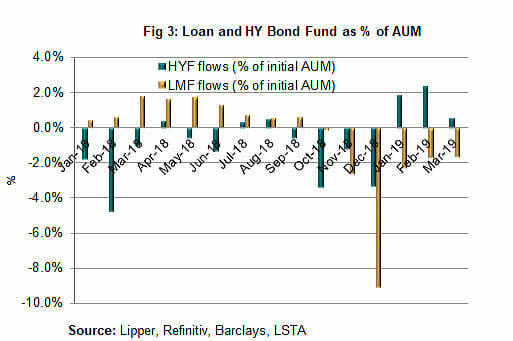
In turn, we weight the size of outflows by the original size of loan and high yield bond mutual funds. As Fig. 3 illustrates, in December 2019, loan mutual funds suffered redemptions equivalent to 9% of their assets under management; high yield bonds suffered redemptions of “only” 3.3%. Thus, loan mutual funds needed to sell a much larger share of their assets to meet redemptions.
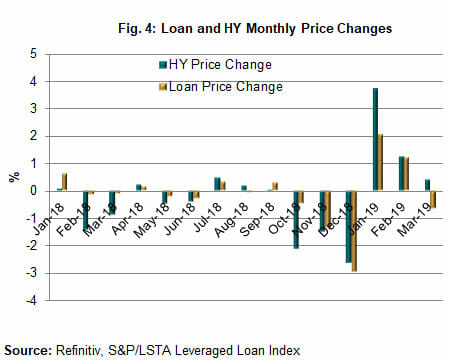
Next, we compare the impact of this selling pressure on loan prices vs. high yield bond prices. As Fig. 4 demonstrates, in December, the price of loans dropped 2.9 points, as compared to a 2.6 point decline for high yield bonds. In other words, even though loan mutual funds had relative outflows of 9% vs. 3.3% for high yield bonds, loan prices dropped just slightly more. We view this as an indication that loan trading liquidity held up.
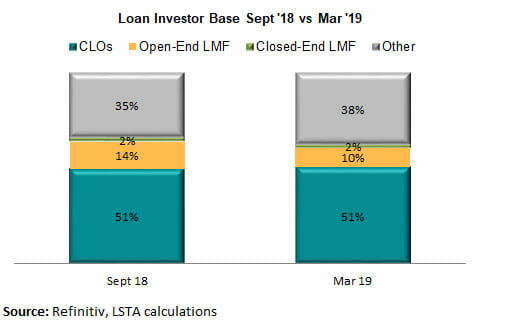
One reason the loan market could hold up well in the face of large redemptions is that mutual funds are a relatively small part of the loan investor base. As Fig. 5 shows, at their high point in September 2018, open end loan mutual funds comprised just 14% of loan market assets. (By March 2019, this had dropped to 10%.) Almost all other investors – such as cash flow CLOs and Separately Managed Accounts – are long-term investors with no or limited redemption rights. In fact, we have been told that while loan mutual funds were selling in December 2018, many other investors saw it as an opportunity to buy (and thus stabilize the market).
Loan Mutual Funds and Liquidity Risk Management: While we observed that loan trading liquidity held up in December 2018 and that loan mutual funds met their redemption requests, that doesn’t answer the question of how funds managed their liquidity. To answer that, we asked managers directly about their liquidity risk management processes. Loan mutual fund managers said that they had been working to conform to the SEC’s liquidity risk management rule. This meant that they had to have a general liquidity management plan blessed by their boards and also had to identify a Highly Liquid Investment Minimum (“HLIM”), which are comprised of investments that could be sold and settled in one to three days. (The HLIM is higher for loan mutual funds because loans are predominantly classed in the “Less Liquid” Category.) In addition, nearly all loan mutual funds have lines of credit that bridge the gap between the sale and settlement of loan assets. Loan mutual fund managers said that they used their long experience to successfully predict redemption patterns in normal and stressed environments (a specific part of liquidity risk management plans) and sell loans (and settle those sales) well ahead of redemptions. While many managers said they found ample liquidity in the loan market, others noted that they also did sell some of their T+2 securities (which were part of their HLIM). Finally, we have not heard of any managers that felt they needed to tap their line of credit to meet redemptions.
Lessons Learned: The LSTA asked loan mutual fund managers what were the December 2018 lessons for liquidity risk management. These managers said that the natural experiment affirmed their liquidity risk management plans and HLIMs. As a result, most viewed the experience as a successful stress test of their liquidity risk management strategies.


