
June 4, 2020 - The good news: The LevFin market has returned. The less good news: Much of the action is in bonds, not loans. The bad news: It’s a long way to normalcy. Below we discuss today’s trends, as well as what may lie ahead.
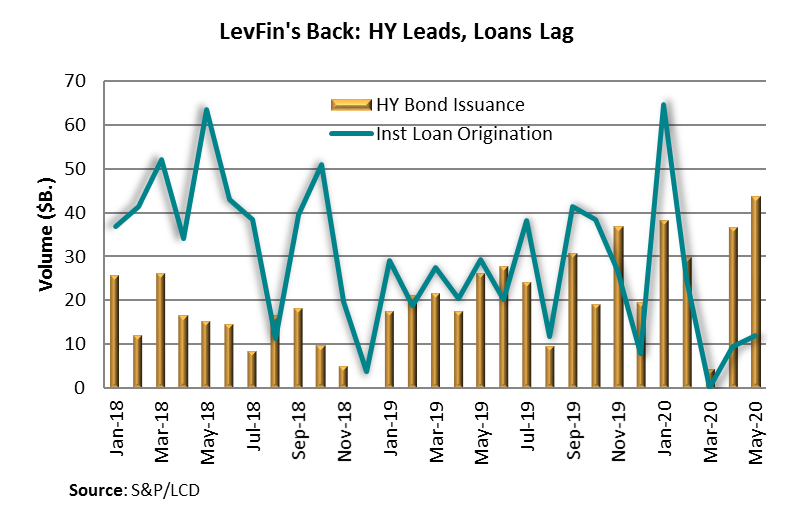
First, the volumes. As the COW demonstrates, both loan and high yield bond activity has returned, but bond issuance is magnitudes higher. In March, loan volume dropped to zero and HY bond issuance to $4 billion, according to S&P/LCD. In the two months since, bonds have seen $80 billion of issuance; loan activity has limped out of the gate at $22 billion. Many bonds seem like relatively clear replacements for loans: A number have five year tenors and two year non-calls, while over one-third of May deals were secured. (And creatively so! According to Covenant Review, one company pledged several islands in the Bahamas!) As Refinitiv noted, the shift to high-yield was largely driven by investor demand; since early April, HY bond mutual fund inflows totaled more than $28 billion. In the same period, loan flow numbers were a negative $3 billion, according to Refinitiv and Lipper. (Both numbers reflect weekly reporters only.) And while CLO issuance technically topped $5 billion in May, a number of deals were print-and-sprints or cleared existing warehouses, thus adding modestly to actual loan demand.
Barclays expects these loan and bond volume trends to continue. In early May, they revisited their HY bond issuance and loan origination forecasts. HY bond issuance is expected in the $290-310 billion context, up from previous estimates of $240-260 billion. The higher volumes will be driven by refinancings (as companies look to manage both bond and loan maturities) and general corporate purpose (“GCP”) funding (to meet free cash flow needs in a challenging Covid-19 environment). In contrast, Barclays is forecasting $210-230 billion of leveraged (institutional) loan origination, down from previous estimates of $300-320 billion. The decline is due to: 1) a sharp drop in M&A/LBO/dividend activity and 2) lower refinancing activity as opportunistic refis decline and many necessary ones move to the friendlier high yield market. That said, GCP activity also may increase in loans as companies look to bridge negative cash flows until the world reopens.
While lending was dwarfed by bond issuance, the loan market did reopen and normalize somewhat. LevFinInsights heralded the return of “regular-way” loans with Next Gen “Zone Charts”. LFI tracked 10 “regular-way”, e.g., not rescue financings, in May, up from four in April. As the market stabilized and regular(ish) deals returned, terms turned slightly in the direction of normalcy. As LFI’s first chart demonstrates, after witnessing very high spreads (LIB+619) and tighter doc scores (2.88) in April, terms eased a bit in May. Average spreads tightened to a mere 589 bps, while doc scores loosened to 3.38. Of course, while loan terms are trending slightly toward normalcy, it’s going to be a long time getting there. S&P/LCD reported that one-third – or more than 430 – of S&P/LSTA Index loans were downgraded since the beginning of March. And while default rates aren’t terrible right now – 3.14% – they probably aren’t going to stay there. Fitch suggests 5-6% default rates by year end. Meanwhile, S&P breaks out its March 2021 speculative grade default forecasts (including HY bonds) into a benign scenario (6% default rate), base forecast (12.5%) and pessimistic forecast (15.5%). So, whatever way one cuts it, it’s probably a long road back.


