January 25, 2018 - Last week, we tiptoed into the issue of leverage levels, incrementals and EBITDA adjustments. This week, we go (a little) further into the weeds, discussing covenant lite default and recovery experiences (with caveats) and capital structure trends. While this is not necessarily a heartening topic, we do end with a modest silver lining.
To begin, covenant-lite loans. Market observers have long intuited that recoveries on cov-lite loans might be lower because, without maintenance covenants to trigger covenant breaches, struggling companies would not be forced to tighten structures or moderate behavior. In turn, their defaults may come later, after more value has been lost. However, there simply hadn’t been enough cov-lite loan defaults to test this theory. But recently, Fitch published data – with notable caveats – on covenant lite defaults and recoveries. Fitch used 30-day post-default secondary loan prices as an initial measure of recovery given default (RGD), acknowledging that this is an early and imperfect measure of recovery. They observe that the trading recovery of defaulted 2016 cov-lite loans was 64%, while the recovery of fully-covenanted loans was 83%. But don’t take these figures at face value. First, they are 30-day post-default prices, which do not always correlate to ultimate recovery. When looking at prices of the loans at emergence, the pattern reversed: the 2016 covenant lite loans saw an 82% recovery, while the fully covenanted loans’ average emergence price was 63%. Second, the cohort matters. The 2016 defaulters were heavily skewed toward energy and retail, which traded down sharply in the downturn. Moreover these borrowers typically had covenanted ABL or RBL loans ahead of the cov-lite institutional loan; these can absorb much of the companies’ value. So while this is an interesting first step toward quantifying the value of covenants, it’s not dispositive. In addition, it may support the thesis that it’s structure and subordination – not covenants – that really matter for recovery.
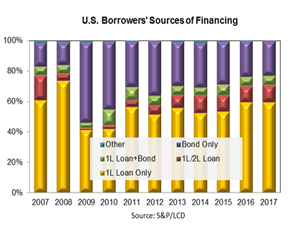
So how is structure and subordination trending? It’s a well-known fact that sponsored borrowers have a predilection for prepayable bank loans. In turn, financing activity in recent years has skewed toward the bank loan product. As the LSTA Chart of the Week  illustrates, first lien-loans accounted for 59% of 2017 leveraged finance activity and another 11% has come from first- and second-lien loan combinations. (Caveat: These numbers include refinancings, skewing the loan market share upwards.)
Likewise, according to S&P/LCD’s Quarterly, leverage multiples on large corporate LBOs peaked at 6.23x in 2007, fell during the financial crisis, and rebounded to 5.79x in 2017. However, subordination – debt cushion below the first-lien loan – declined from 35% in 2007 to 22% in 2017. Earlier research by S&P/LCD demonstrated that there is an strong relationship between the size of the debt cushion (subordination) and loan recovery given default – the greater the subordination, the higher the recovery. Loans with a whopping 75% debt cushion saw an average discounted recovery of 93%, while those with a debt cushion of 25% or less saw an average 69% recovery.
While that might not bode well, there is some short-term good news. Recovery given default doesn’t become a major issue until there are major defaults – and few observers see that happening soon. Moody’s points out that their Liquidity Stress Index (LSI) is at a record low of 2.4%, down from more than 10% in early 2016. In turn, Moody’s sees the Spec-Grade Default rate falling to 2.4% at the end of 2018, down from 3.3% at the end of 2017.


