January 18, 2018 - Last year, lenders bemoaned the deterioration in loan documentation, such as EBITDA adjustments, incremental baskets and the ability to transfer collateral. This week, Xtract and Covenant Review spilled considerable ink dissecting these 2017 document trends.
Xtract focused its ire on the increasing add-backs to EBITDA, with a particular emphasis on cost saving add-backs that may not be completely defensible. According to their statistics, by 4Q17, 59% of sponsored leveraged loans did not cap such EBITDA add-backs.
The impact of these add-backs, and the consequently overstated EBITDAs, cascades through credit agreement provisions. Xtract points out that EBITDA functions as the denominator in leverage ratios and the numerator in coverage ratios. Thus, as EBITDA inflates, those ratios become easier to achieve and, crucially, any activity governed by those ratios also becomes easier to undertake. As an example, Xtract looked at the percentage of large sponsor leveraged loans that have a “free and clear” prong of an incremental facility that is calculated as the greater of a fixed dollar amount or a percentage of EBITDA. In 4Q17, more than 60% of large sponsored loans used this language. Theoretically, EBITDA is being inflated by add-backs and then this higher EBITDA drives larger incrementals.
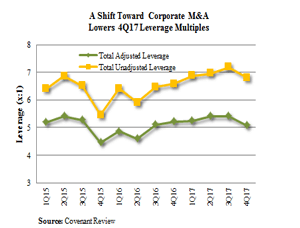
Do these trends show any signs of reversing? At first blush, Covenant Review’s Trendlines is somewhat encouraging. As the LSTA COW  demonstrates, the average adjusted total leverage ratio for M&A-related loans edged down to 5.09x in the fourth quarter from 5.42x in the third quarter.
But don’t uncork the champagne just yet. First, that same leverage ratio using unadjusted EBITDA is 6.81x (admittedly down from 7.2x in third quarter). Second, adding in the free and clear accordion pulls reported leverage up to 8.03x (down from 8.17x in third quarter).
And third, one shouldn’t just look at averages; one must consider cohorts. The average leverage levels within each of Covenant Review’s cohorts (large sponsors, mid-sized sponsors and non-sponsored corporates) stayed roughly the same. However, the market share of non-sponsored companies – which typically sport lower leverage than sponsored companies – increased. Thus, the apparent decline in leverage is a function of increased non-sponsored corporate activity, not leverage itself declining.
So, where do we go from here? Until technicals turn or defaults increase, the loosening trend may not slow. We see no indication that technicals are about to become much more friendly. And defaults? After posting a 2.4% default rate in 2017, Fitch sees loan default rates edging up to just 2.5% by the end of 2018.


